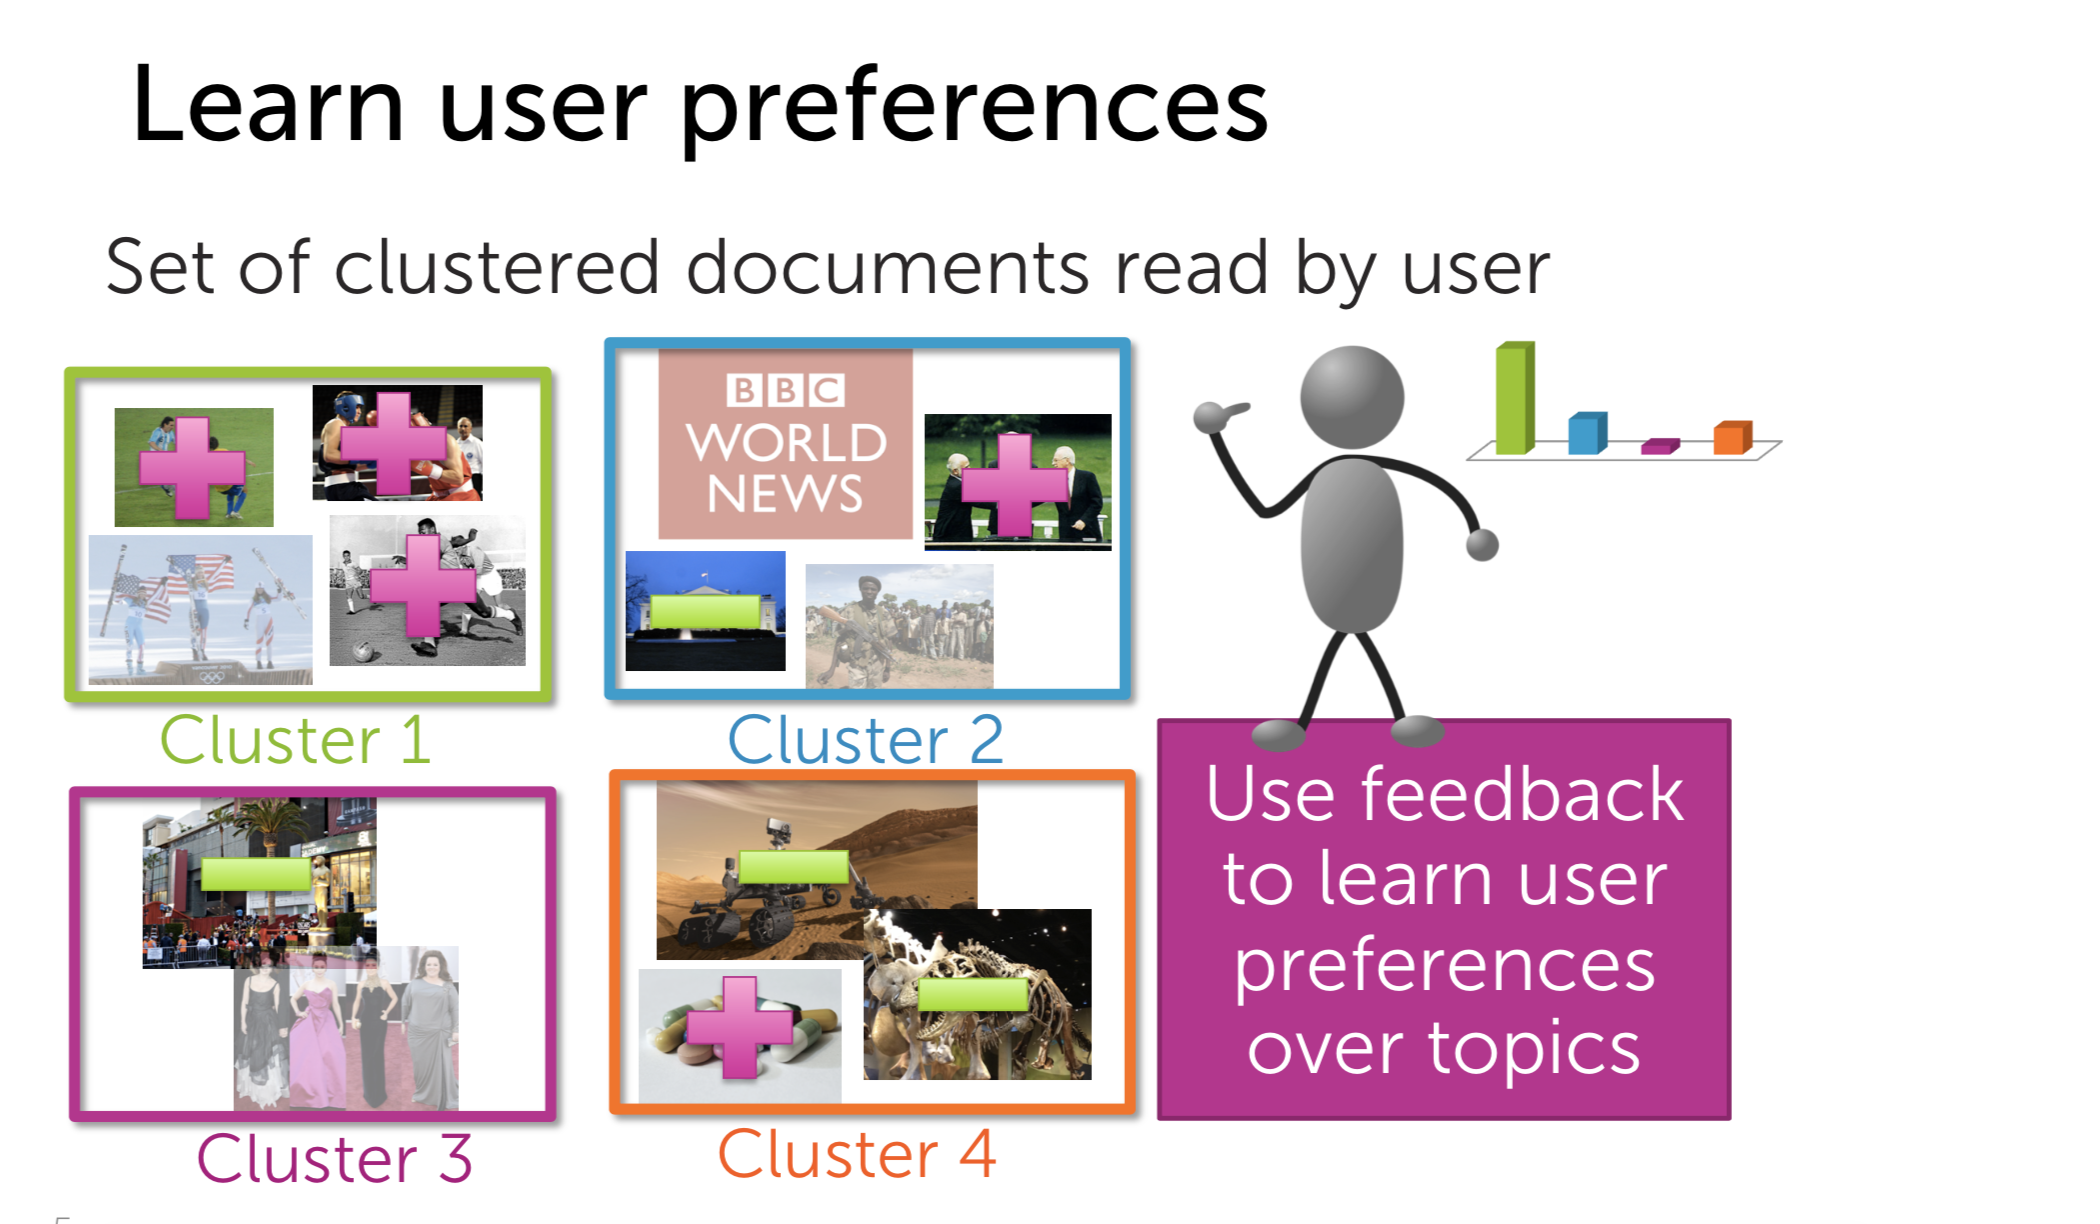
In this blog, I will dive deeper into the techniques of clustering. Clustering or segmentation has wide applications, particularly in RecSys, when you can have the insight about users’s preferences given their activities. For examples, assuming that we have a list of articles that user A reads everyday, we can extract his favorite topics and then give him what he likes.
I. Clustering properties
Clustering, in general, like retrieval, is an unsupervised task. We study the features of the input and then decide which group the input belongs to. Maybe in some cases, the clustering may seem similar to the classification, but the classification has label for each input whereas the clustering doesn’t.
So what a cluster is and what characterizes it? A cluster in space is a group of similar points which stay near each other. Each cluster is defined by its centroid and its shape. An observation \(x_i\) is assigned to cluster \(C_j\) if the score between \(x_i\) and \(C_j\) is the smallest in comparison to other clusters
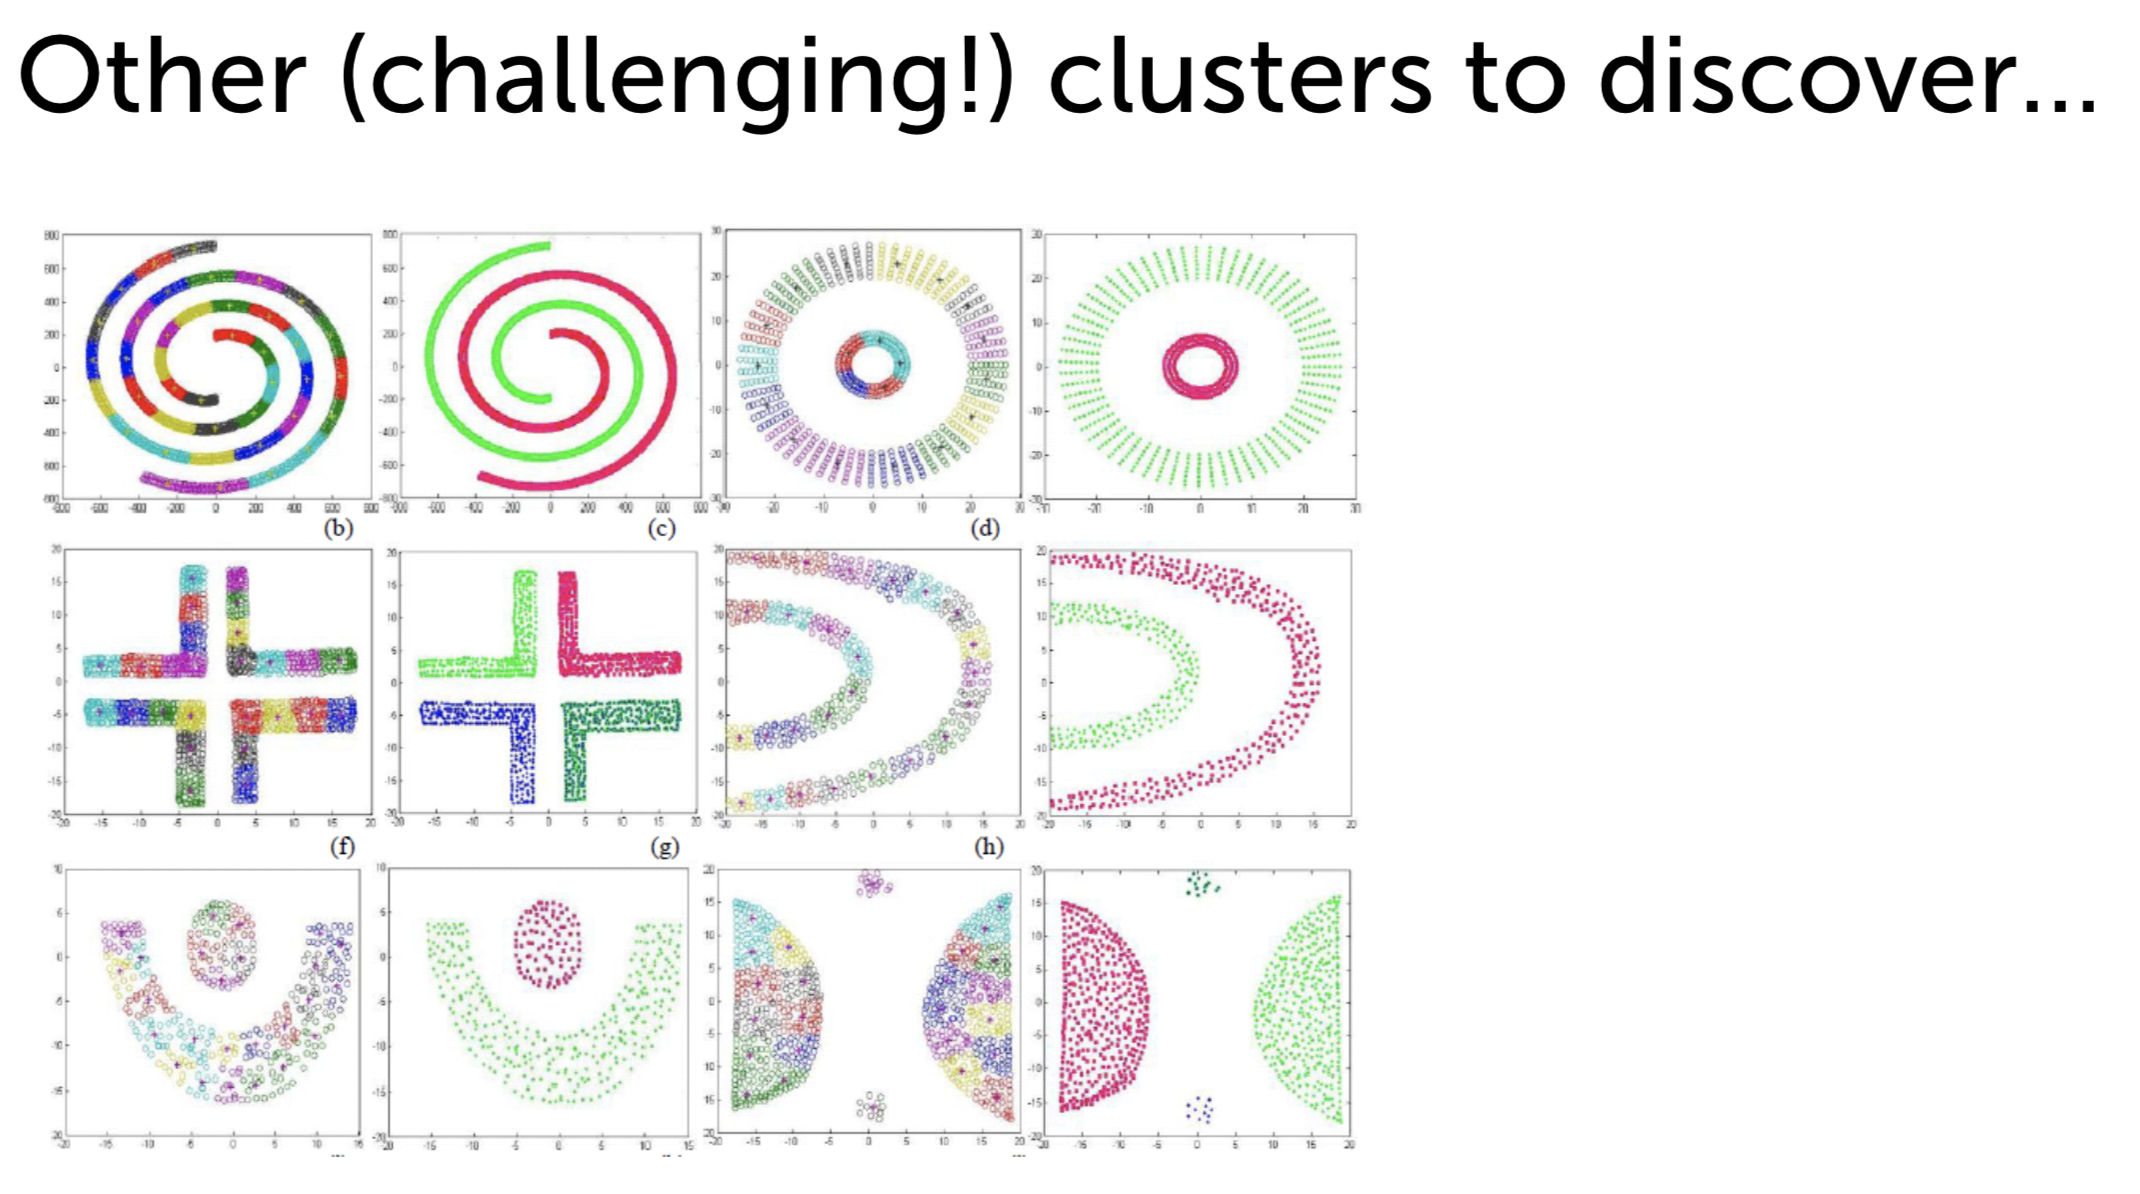
There are many topologies which challenges the data scientist to cluster:
II. K-Means Clustering
K-means is a symbolic approach in Clustering. In K-Means, the score is the distance between the observation and the centroids of the clusters (the smaller the better). This method helps us to divide our elements set into k clusters
In K-Means, there are 4 steps:
-
Initialize the cluster centroids(They are preferably k points from the space)
-
Assign the observation to the closest cluster using the distance between the observation and the centroids
\[z_i = argmin_j ||\mu_j - x_i||^2_2\] -
Update the coordinates of the clusters using the mean of every points assigned to that cluster
\[\mu_j = \frac{1}{n_j} \sum_{i: z_i=j} x_i\] -
Repeat step 2 & 3 until convergence
In fact, the above process is inspired from E-M Optimization. It includes 2 step: Expectation and Maximization until convergence. It has another name: alternating minimization.
K-Mean guarantees that we could reach the local optimum for the problems. It also means that the result of the algorithm strongly depends on the initialization of the centroids. Furthermore, it also depends on the hyperparameter \(k\) to fine-tune this parameter, there is a techniques called elbow method. You can get more detail about it from the Internet.
As you can see, initialization plays an important role in K-Mean, then if we could somehow optimize it, K-Means will be more effective. This is why they invent kmean++
K-Means ++
The intuition of the method is to choose the centroids which are far from each other so that the boundary between the cluster will be more well-defined.
Algorithm:
-
Choose the first centroid randomly from the data points
-
Compute the distance between every data point and the chosen centroid
-
Choose the next centroid from the data points with the probability which is proportional to the distance to other centroids. We hope the next centroid will be far from the chosen centroids
-
Keep doing the step 2 & 3 until we have \(k\) centroids.
-
Do the E-M Optimization like the normal K-Means
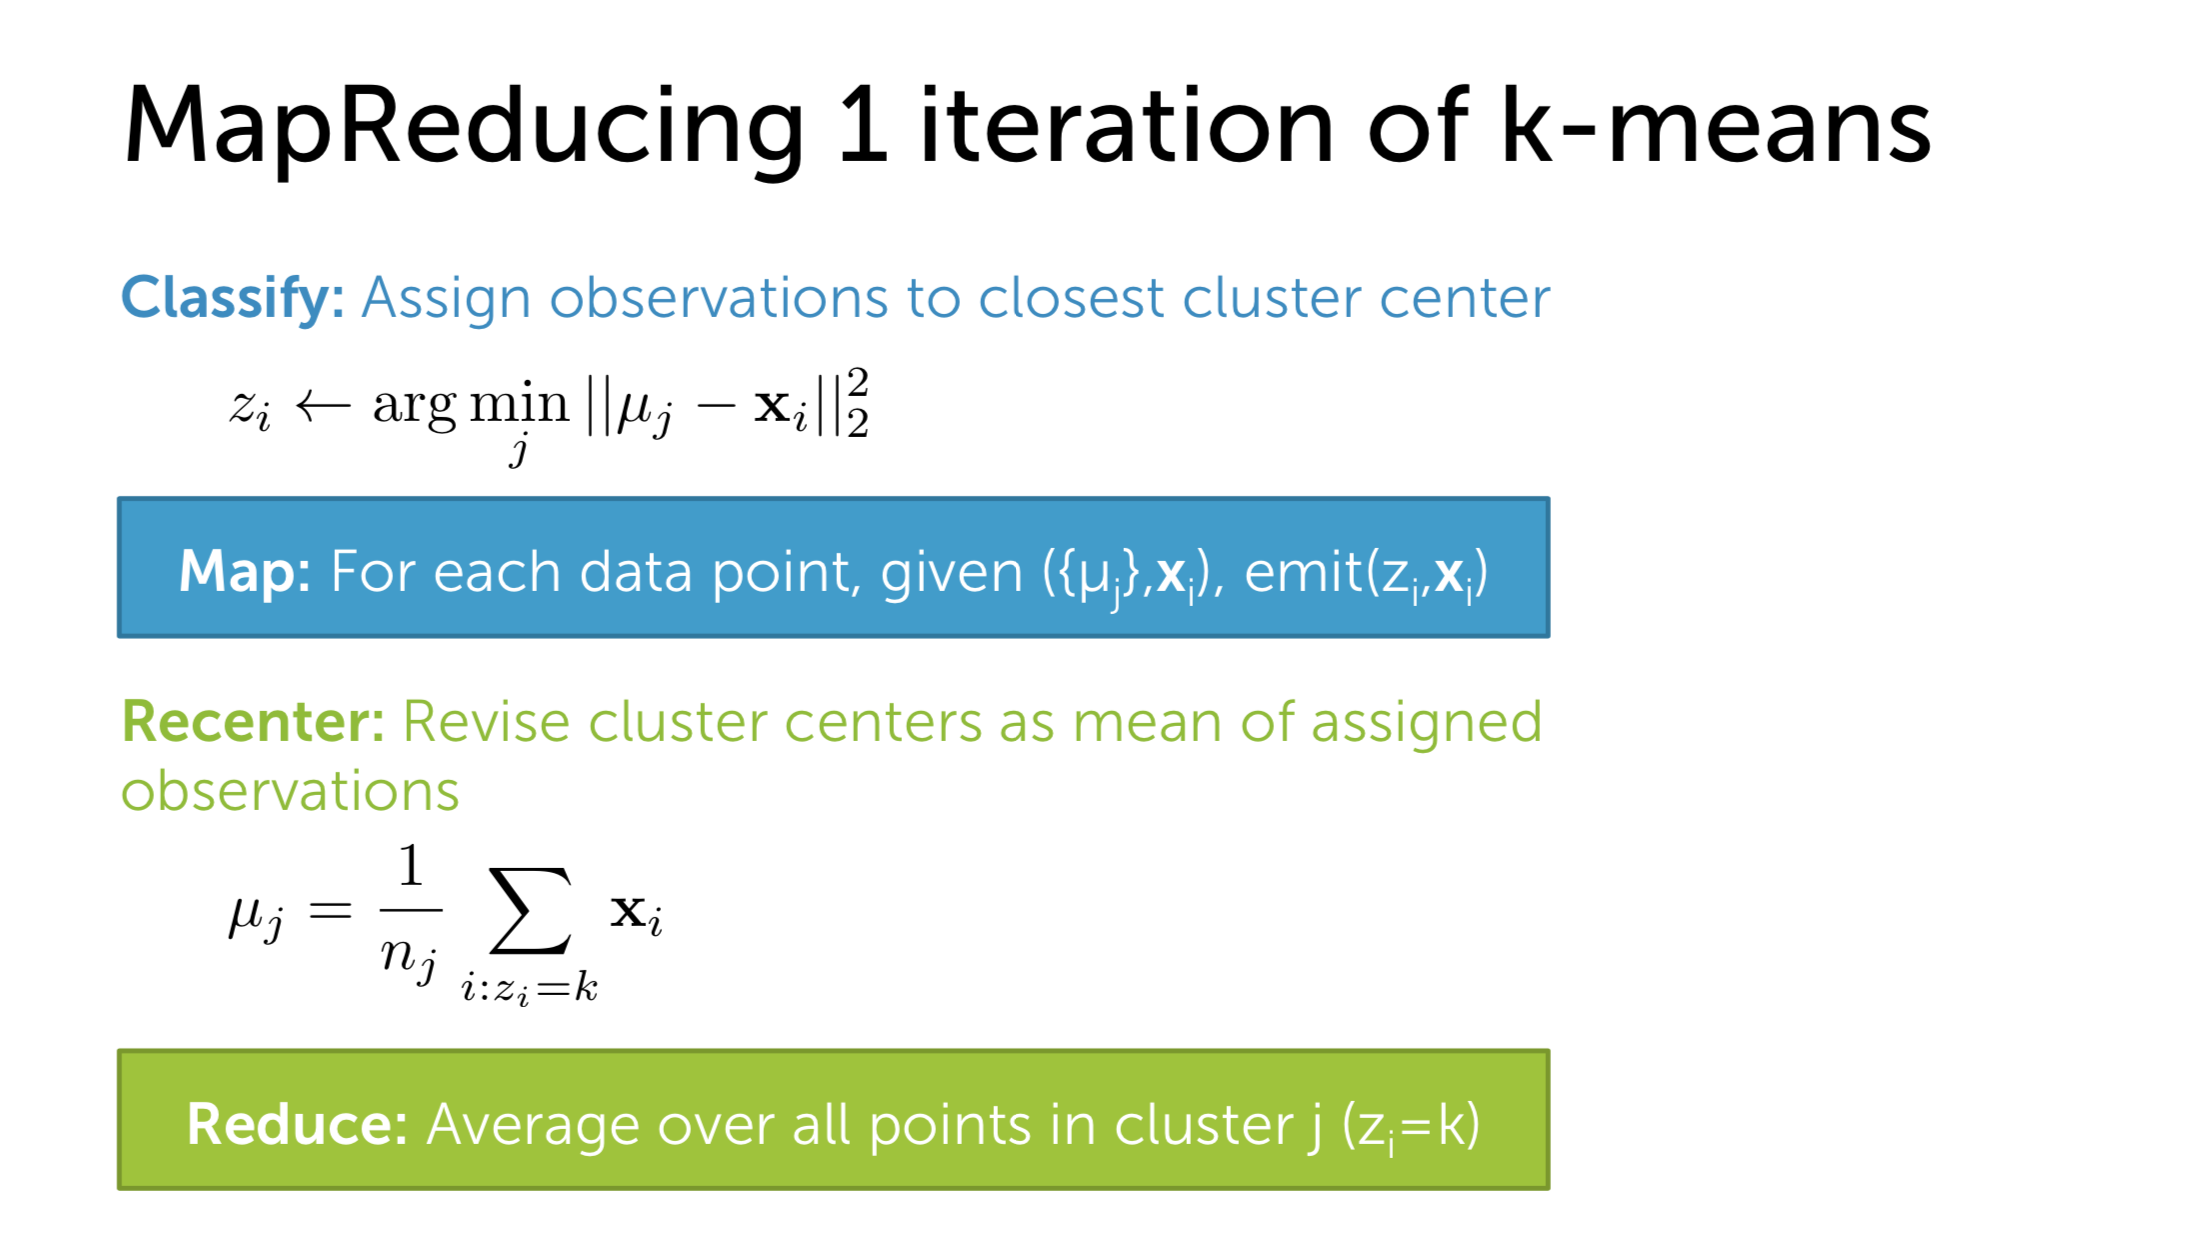
III. MapReduce K-Means
Apart from K-Means, there are many other clustering algorithms, like: DBSCAN, Gaussian Mixtures etc. However, K-Means is still the bias of many data scientists because of two reasons: its simplicity and its ability to compute in parallel. How to do so?
Nowadays, most parallel computing frameworks in Big Data employs the mechanism of MapReduce. More detail about this mechanism can be found in this blog. Fortunately, two steps of cluster assignment and centroids update fit perfectly MapReduce.
In the Map phase, we distribute the data points to the mapper. The mapper now computes the distance from data points to the centroids and then do the assignment. In the Reduce phase, every data points with the same labels will go to the same reducer and each reducer will update the centroids. The above process will be repeated until convergence.
IV. DBSCAN
As stated previously, deciding the hyperparameter k is really hard to obtain the optimal value. In this section, I want to discuss briefly another clustering technique named DBSCAN. There are two parameters worth noticing: minPoints and \(\epsilon\).
Algorithm
-
Firstly, we pick randomly an unvisited data-point and study its neighborhood defined by \(\epsilon\). If there are enough points within the neighborhood(minPoints), the clustering starts and the current points will belong to the a new cluster, otherwise it is labeled as noise and the process stops here, noise can be consider as leaf in tree data structure. Either way, it is reclassified as visited point.
-
For every point that stays in the neighborhood of a clustered point, it will reside in the same cluster.
-
We keep the above clustering process for the points in the neighborhood of other clustered point until every point in space is marked visited.